
Choose useful measures
Focus on the numbers tied to your goals.
Traffic, inquiries, sales, and campaign costs should help you make decisions. We’ll help turn scattered reports into a clearer view of the business.
Request a consultation →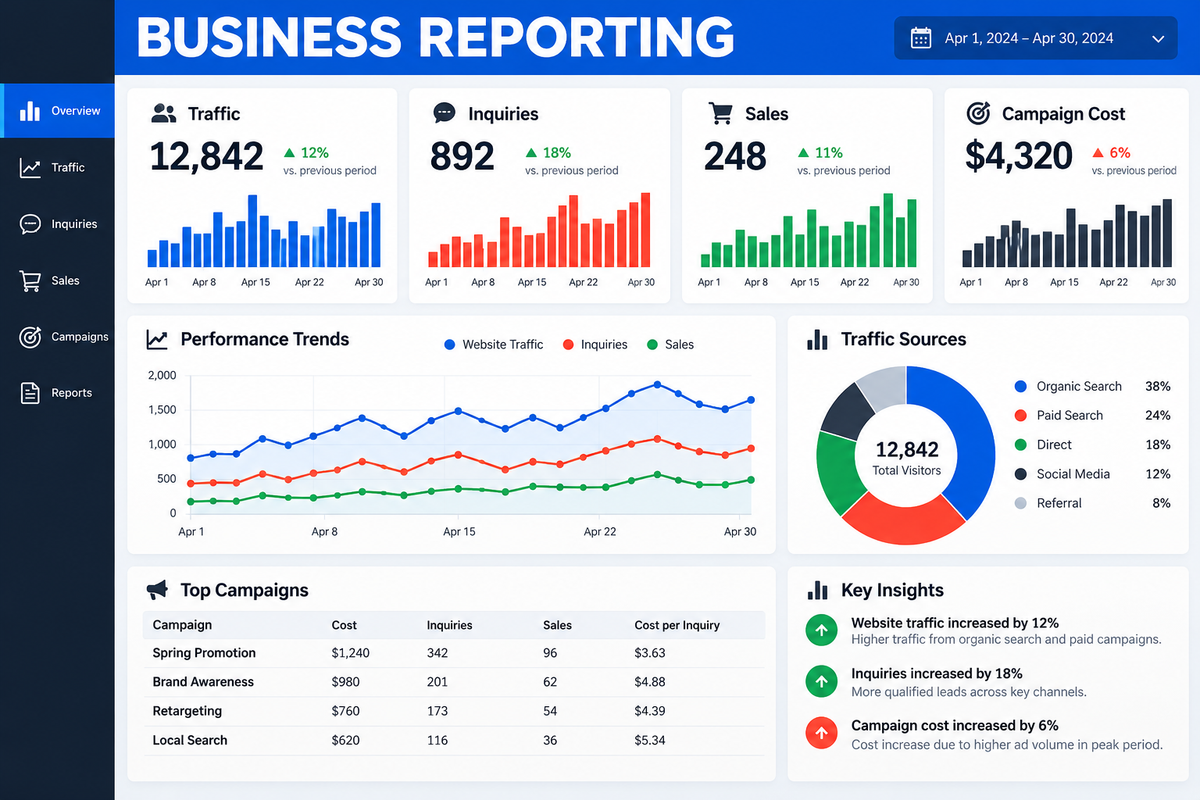
Focus on the numbers tied to your goals.
Compare information from the tools you use.
Make trends and questions easier to understand.
Build a reporting routine you can return to.
The scope, deliverables, price, and estimated timing are agreed before work begins, with updates throughout the project.
Owners who need a clearer view of website inquiries, store activity, campaign costs, or recurring business performance.
Your main business questions, the tools you currently use, existing reports, and which actions should count as inquiries or sales.
The quote confirms deliverables, revisions, responsibilities, and estimated timing before work begins.
Request a Quote →A useful report begins with a business question: which service pages generate inquiries, where advertising costs are going, or which products need attention. We agree on the measures that can help answer it and identify the data available. A dashboard full of numbers can still be unhelpful if nobody knows which decisions it is meant to support or which actions count as success.
Website events, form submissions, platform sales reports, and campaign reports may each describe a different part of the customer journey. We review the agreed sources and look for missing or duplicated measurements. Privacy choices, platform limitations, and device changes can affect tracking. The setup and report should explain those limitations rather than imply that every interaction or sale is perfectly visible.
A lead, sale, conversion, or return can mean different things in different systems. We document the definitions used in the report and the date ranges being compared. Where sources disagree, the difference should be explained rather than hidden. Reporting can distinguish activity from outcomes and identify questions worth investigating, without treating every movement in a chart as proof of a particular cause.
The output might be a dashboard, a recurring summary, or a focused review of an existing report. We agree on who reads it, how often it is updated, and what commentary is useful. A handover can explain the measures and where the data comes from. Ongoing interpretation, maintenance of integrations, and campaign or website changes based on the findings are separate scope decisions.
A business receives inquiries through a form and phone calls but only looks at total website visits. A possible project could define the actions it wants to measure, review the available tracking options, and create a report connecting page activity to recorded inquiries. Calls or offline sales that cannot be reliably connected would be identified as measurement gaps rather than guessed.
The number of data sources, tracking changes, integrations, dashboard requirements, and reporting frequency affect the quote. Setup work, recurring analysis, and acting on the findings can be agreed as separate services.
Discuss Analytics & Reporting →No. Tracking can be affected by privacy choices, device changes, platform limits, and setup. We’ll explain the limits.
Yes. We start with the data and platforms available to your business.
Yes. Reporting frequency and ongoing support can be agreed separately.
Yes. A review can identify missing events, duplicate tracking, and reporting gaps within the agreed tools. Any changes and measurement limits are explained.
They may use different attribution rules, time periods, or definitions, and tracking can be incomplete. We can review the selected reports and explain the differences that can be established.
Yes. A focused summary may be more useful than a new reporting tool. The format should match the decisions you need to make and the data available.
Share your current website, requirements, or questions to discuss the next steps.